Findings · v1.0.1
12 findings from 99 deals
Every finding is one sentence with its number, calculated from the data for deals from 23 January 2023 to 17 November 2026. On-hold deals are not counted. 36% of the deals are core deals.
Chapter 1 of 4
Who is buying
13 buyers have core deals. A few large companies account for most of them.
Google has made 10 of the 36 core deals, more than any other buyer.
13 buyers have at least one core deal. For example, Google’s most recent is with Salient Predictions.
Hidden Acquisitions Index, v1.0.1, deals to 17 November 2026
Core deals by buyer, top 10
Google (10), Apple (6) and Microsoft (4) have the most core deals.
Google’s 11 coded deals are mostly with applied AI & agents companies.
59 of the 99 deals have the company’s AI layer coded. Each cell counts deals for that buyer and layer.
Hidden Acquisitions Index, v1.0.1, deals to 17 November 2026
The AI layer of the companies, by buyer
Rows are the 8 buyers with the most coded deals.
| AI infrastructure & chips | Applied AI & agents | Data & autonomous systems | Foundation models | |
|---|---|---|---|---|
| Google (11) | 0 | 8 | 0 | 3 |
| Microsoft (8) | 1 | 2 | 0 | 5 |
| Amazon (6) | 0 | 1 | 1 | 4 |
| Apple (6) | 2 | 4 | 0 | 0 |
| NVIDIA (6) | 1 | 0 | 0 | 5 |
| OpenAI (4) | 1 | 2 | 0 | 1 |
| AMD (3) | 1 | 0 | 0 | 2 |
| Alibaba (2) | 0 | 0 | 0 | 2 |
50 of 86 deals have a US buyer and a US company.
The rest cross a border or sit outside the United States. For example, South Korean buyers appear in 13 deals.
Hidden Acquisitions Index, v1.0.1, deals to 17 November 2026
Buyer country to company country
The 12 most common pairs. Deals without both countries recorded are left out.
- United StatesUnited States
- South KoreaUnited States
- United StatesCanada
- JapanJapan
- South KoreaSouth Korea
- United StatesFrance
- United StatesUnited Kingdom
- South KoreaCanada
- ChinaChina
- United StatesAustralia
- South KoreaJapan
- United StatesUnited Arab Emirates
5 buyers came back to the same company. NVIDIA and Emerald AI have 4 deals.
Each dot is one deal, coloured by structure. Later deals are often new investment tranches.
Hidden Acquisitions Index, v1.0.1, deals to 17 November 2026
Repeat relationships, shown as tranches
Buyer and company pairs with more than one deal.
- NVIDIA and Emerald AI (4)
- Google and Anthropic (3)
- Amazon and Anthropic (3)
- Microsoft and OpenAI (2)
- KDDI and Sakana AI (2)
Chapter 2 of 4
How deals are built
Five structures recur. The licence and team hire is the template: the buyer gets the people and the technology, and no company changes hands.
47 of the 99 deals are investments and partnerships, the most common structure.
47 investments and partnerships, 19 licence and team hires, 15 investments tied to a compute commitment, 13 team hires, 5 minority stakes with control rights.
Hidden Acquisitions Index, v1.0.1, deals to 17 November 2026
Deals per quarter, by structure, 2023 Q1 to 2026 Q4
2026 had 35 deals, more than any other year.
In 19 of 19 licence and team hires, people moved. 18 included a licence.
Investments move money instead: 28 investment deals carry a recorded money figure or stake.
Hidden Acquisitions Index, v1.0.1, deals to 17 November 2026
What moved, by structure
Each cell counts deals in that structure where the item moved, as the sources record it.
Reading the chart
Rows are structures; the number in brackets is how many deals each has. Darker cells mean more deals. Money includes stakes.
| Licence | Patents | People | Money | Compute | |
|---|---|---|---|---|---|
| Licence and team hire (19) | 18 | 1 | 19 | 2 | 0 |
| Team hire (13) | 1 | 0 | 12 | 1 | 0 |
| Minority stake with control rights (5) | 1 | 0 | 0 | 3 | 1 |
| Investment tied to a compute commitment (15) | 2 | 0 | 0 | 12 | 7 |
| Investment and partnership (47) | 0 | 0 | 1 | 13 | 0 |
31 single amounts are recorded. The largest is US$40 billion, committed by Google.
Amounts are shown one by one and never added together. Paid, committed and invested figures keep their own colour.
Hidden Acquisitions Index, v1.0.1, deals to 17 November 2026
Every single amount, on a log scale
From US$3 million to US$40 billion. Each step on the axis is ten times the last.
Reading the chart
Each dot is one amount from one source. A log scale spaces US$10 million, US$100 million and US$1 billion evenly, so small and large deals fit on one chart.
- Paid
- Committed or up to
- Invested
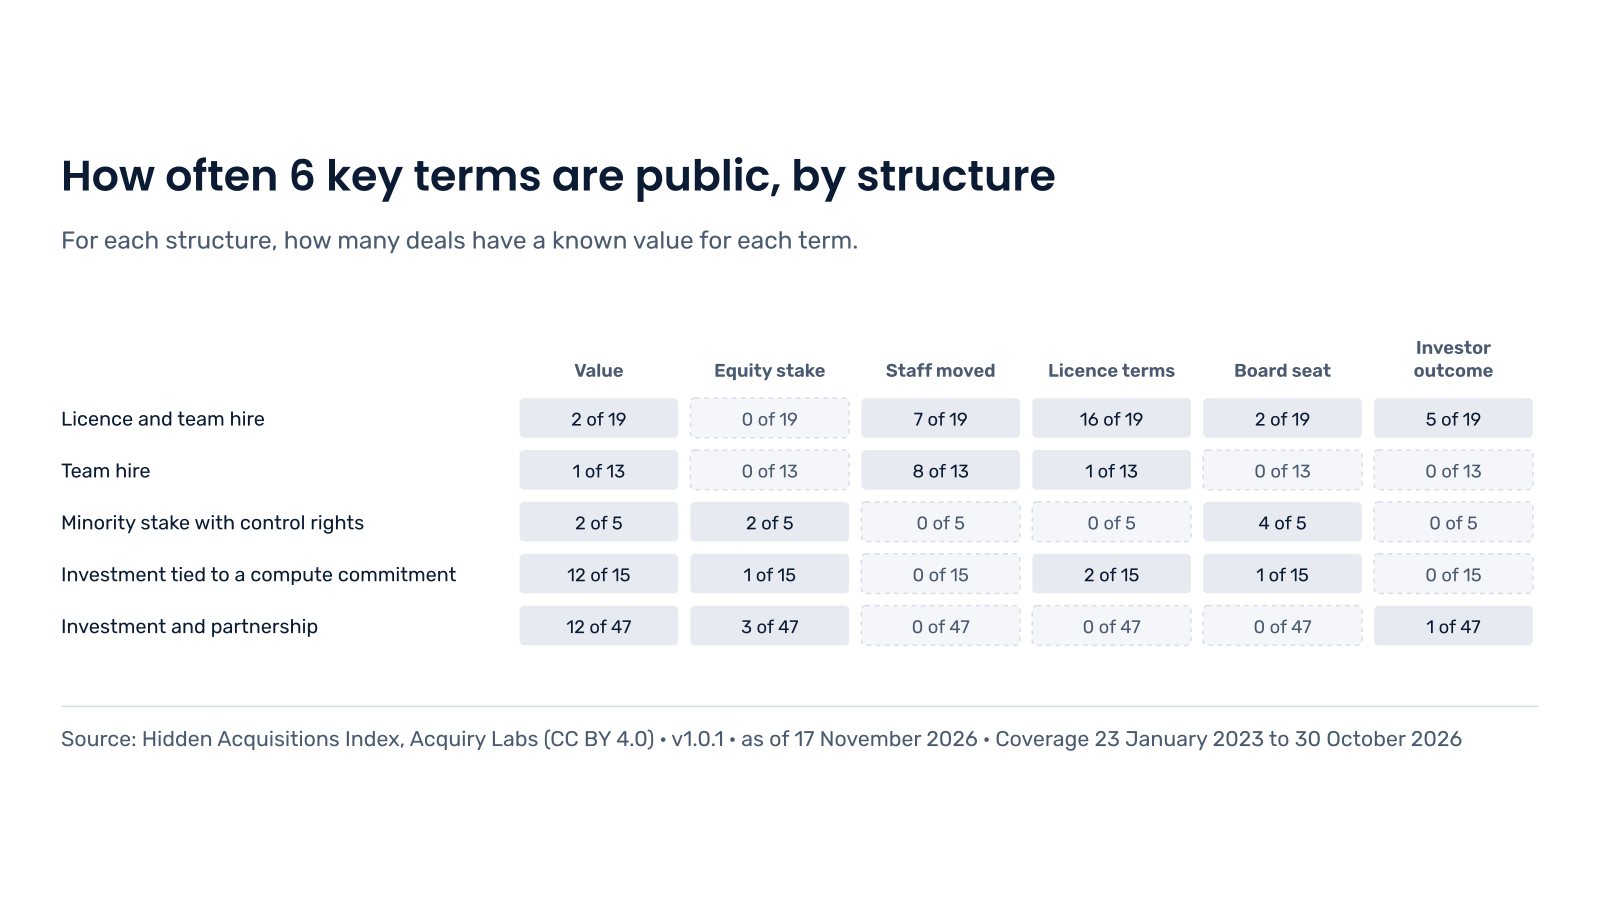
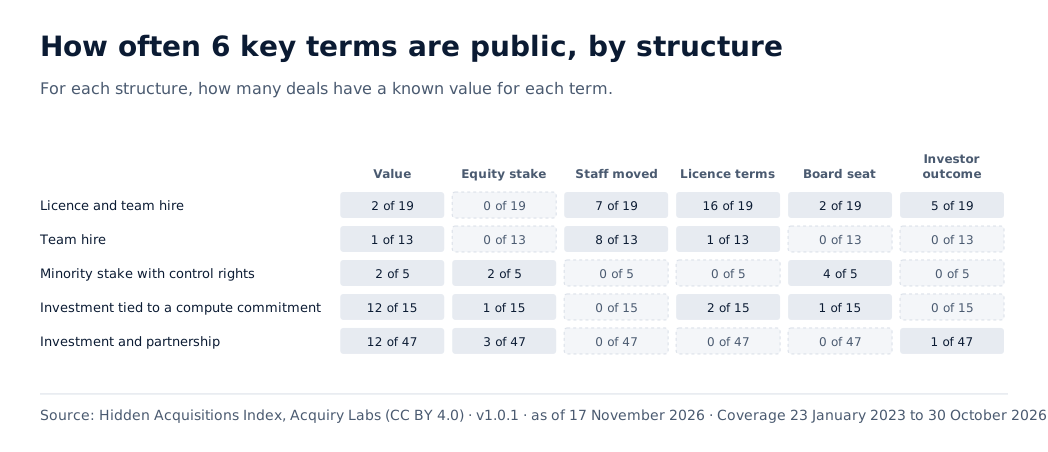
How often 6 key terms are public, by structure
For each structure, how many deals have a known value for each term.
Hidden Acquisitions Index, v1.0.1, deals to 17 November 2026
How often 6 key terms are public, by structure
For each structure, how many deals have a known value for each term.
Chapter 3 of 4
What happens to the companies
41 of 69 companies have a recorded outcome. 30 carried on.
41 of 69 companies have a recorded outcome. 30 carried on.
The others are recorded as sold, product closed, changed direction, bankruptcy and wound down. Each status is the one on the company’s most recent deal.
Hidden Acquisitions Index, v1.0.1, deals to 17 November 2026
Company status at 6, 12 and 24 months
12 of 28 six-month checks show the company carrying on.
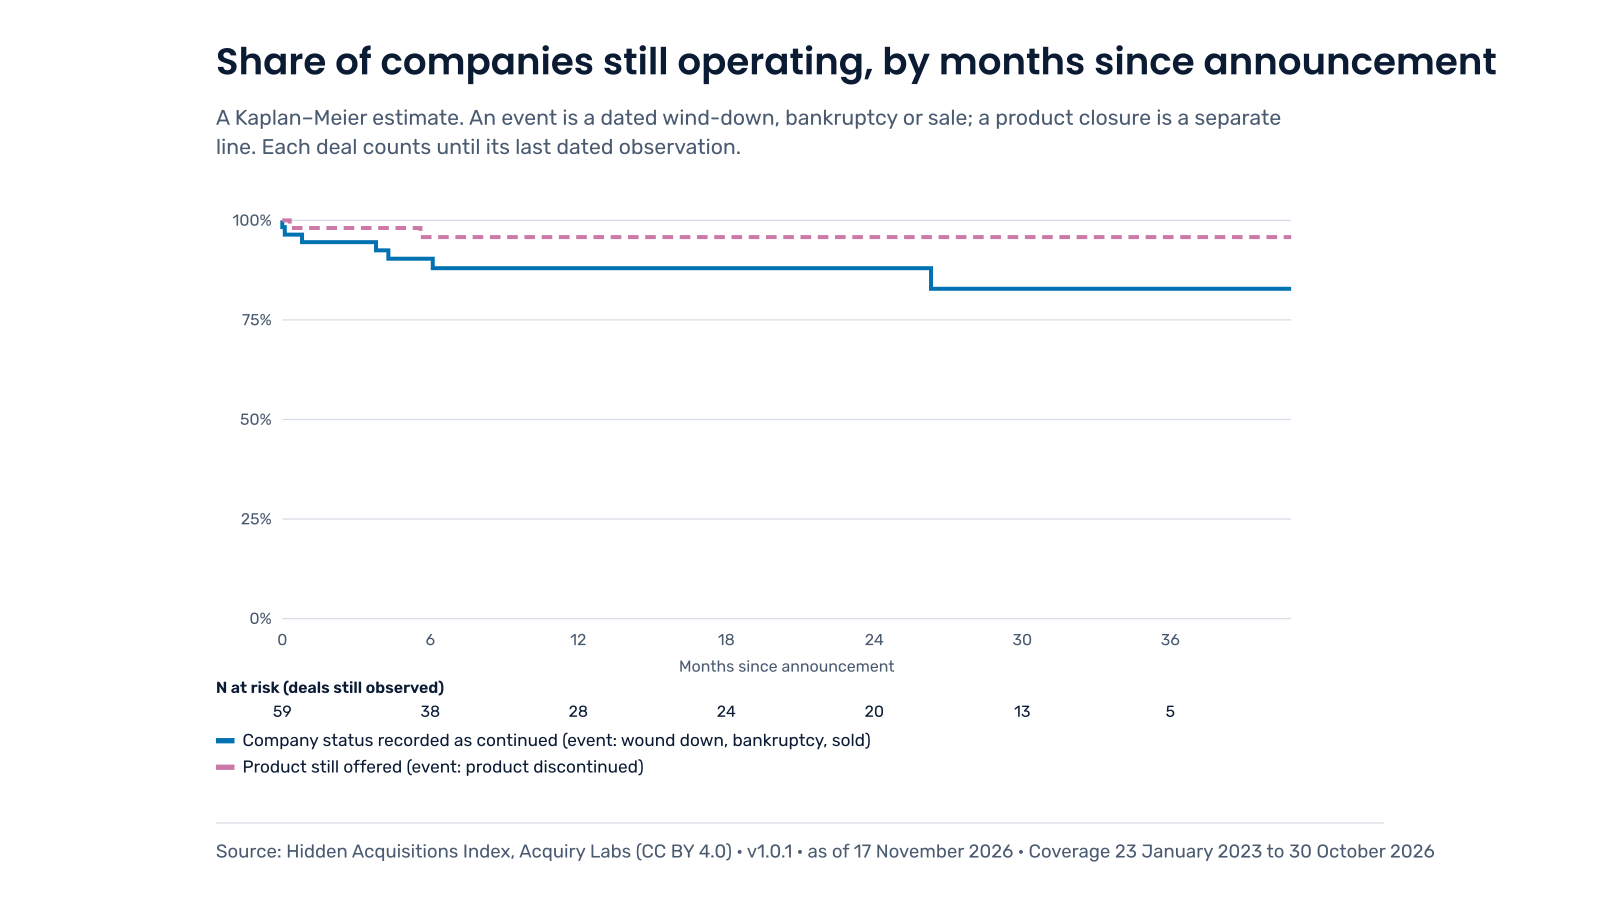
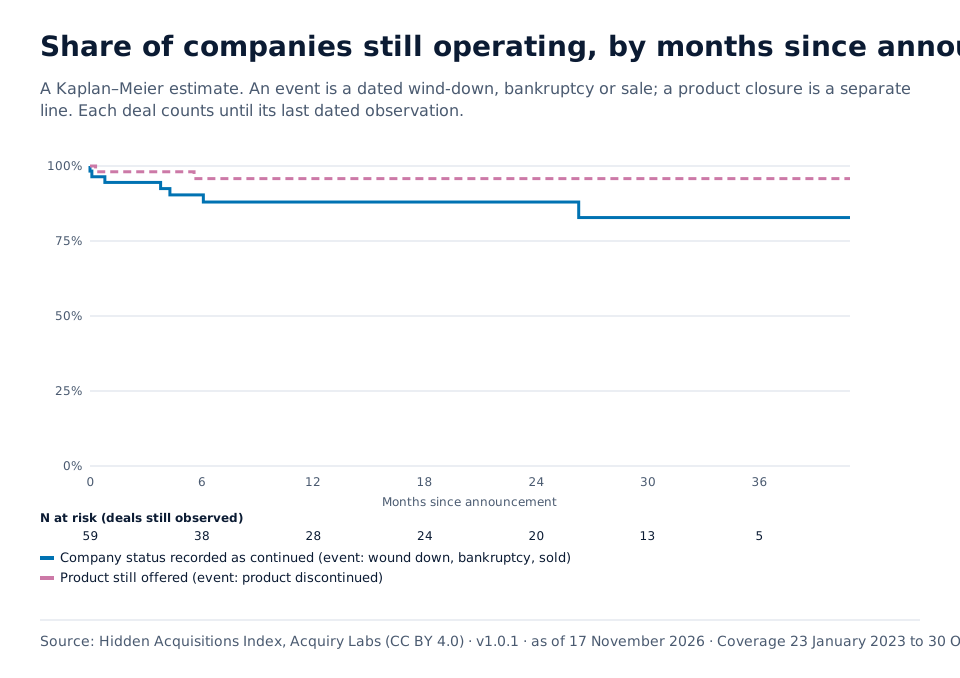
Share of companies still operating, by months since announcement
A Kaplan–Meier estimate. An event is a dated wind-down, bankruptcy or sale; a product closure is a separate line. Each deal counts until its last dated observation.
Hidden Acquisitions Index, v1.0.1, deals to 17 November 2026
Share of companies still operating, by months since announcement
30 of 41 companies with a recorded outcome carried on.
Chapter 4 of 4
How regulators respond
The actions come from six competition authorities: reviews, studies and notifications such as those under Article 14 of the EU Digital Markets Act.
71 competition authority actions cover 24 deals.
European Commission (27), UK Competition and Markets Authority (22) and Australian Competition and Consumer Commission (9) have the most.
Hidden Acquisitions Index, v1.0.1, deals to 17 November 2026
Competition authority actions, by authority and kind
26 are notifications, 28 are reviews and 17 are studies.
Reading the chart
Blue is a review of the deal, purple a sector or market study, grey-teal a notification such as under Article 14 of the EU Digital Markets Act.
10 of 24 deals with an action had it before the deal was first reported.
Most of those are notifications to the European Commission that preceded any public report. The median is 0 days from first report to first action.
Hidden Acquisitions Index, v1.0.1, deals to 17 November 2026
Days from first report to the first competition authority action
Bars to the left of the line are actions recorded before the deal was public. The longest wait is 537 days.
Every chart in the index, 14 in all
- 99 core and related deals by quarter and structureCoverage 23 January 2023 to 30 October 2026
- What the buyer received in 36 core dealsCoverage 3 February 2023 to 30 October 2026
- What happened to the 36 core deals’ companies at 6, 12 and 24 monthsCoverage 3 February 2023 to 30 October 2026
- Competition authority action on 24 dealsCoverage 23 January 2023 to 30 October 2026
- 31 buyers’ deals over timeCoverage 23 January 2023 to 30 October 2026
- Buyers and companies across 11 countriesCoverage 23 January 2023 to 30 October 2026
- Days from announcement to the first competition authority action, 24 dealsCoverage 23 January 2023 to 30 October 2026
- 11 deal values against the US merger-filing size testCoverage 23 January 2023 to 30 October 2026
- How often 6 key terms are public, by structureCoverage 23 January 2023 to 30 October 2026
- 8 of 20 minority investments came with a cloud commitmentCoverage 23 January 2023 to 30 October 2026
- Non-exclusive licence with people moving, by quarterCoverage 3 February 2023 to 30 October 2026
- 36 core deals by buyer and structureCoverage 3 February 2023 to 30 October 2026
- One company valued before and after the dealCoverage 23 January 2023 to 30 October 2026
- Share of companies still operating, by months since announcementCoverage 23 January 2023 to 30 October 2026